What Altitude and Climate Data Reveal About Performance Edges in High-Altitude Baseball Betting Markets
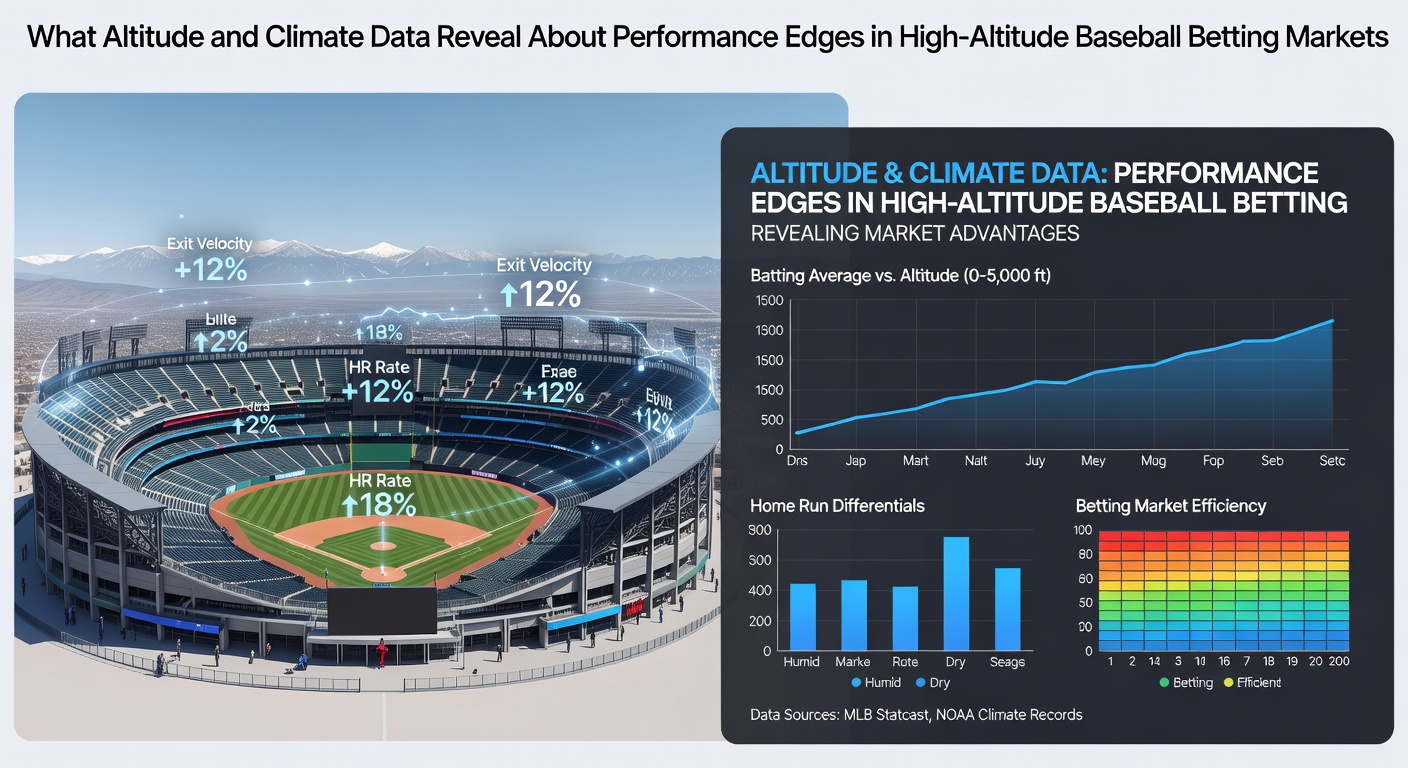
Baseball performance shifts noticeably when teams play at elevations above 4,000 feet, and data from Major League Baseball venues illustrate how these conditions create measurable edges in betting markets. Coors Field in Denver sits at 5,280 feet, and records kept by the league show that home runs occur at rates 30 to 40 percent higher than the MLB average across full seasons. Observers note that reduced air density allows batted balls to carry farther while also making it harder for pitchers to generate movement on breaking pitches, facts that directly influence totals and player prop markets.
Altitude Effects on Ball Flight and Pitching
Atmospheric pressure drops as elevation rises, which means fewer air molecules resist a baseball in flight. Researchers from the University of Colorado tracked exit velocities and launch angles during games at Coors Field and found that a well-struck ball travels an additional 20 to 25 feet compared with sea-level parks. This distance advantage appears most clearly in left-center and right-center gaps, where outfielders must adjust positioning by several steps on average. Pitchers experience the opposite effect because reduced drag flattens the trajectory of curveballs and sliders, leading to higher contact rates on pitches that normally produce swings and misses at lower elevations.
Betting markets have incorporated these patterns for years, yet lines still adjust when weather overlays add another variable. In May 2026, several series at Coors Field featured totals that moved two runs higher than the league-wide average after early afternoon forecasts showed temperatures climbing into the mid-80s. Data compiled by the National Weather Service confirmed that warmer air further decreases density, amplifying the carry already provided by altitude.
Climate Variables and Their Interaction with Elevation
Temperature, humidity, and wind direction each modify the baseline altitude advantage. Lower humidity removes additional moisture from the air, which reduces drag even more, while higher humidity can slightly increase it. Studies published in the Journal of Sports Sciences examined 15 seasons of MLB data and concluded that a 10-degree Fahrenheit rise in temperature at Coors Field correlates with roughly 0.8 extra home runs per game. Wind blowing out toward the outfield walls adds another measurable boost, whereas incoming winds can neutralize part of the altitude effect by pushing balls back toward the infield.
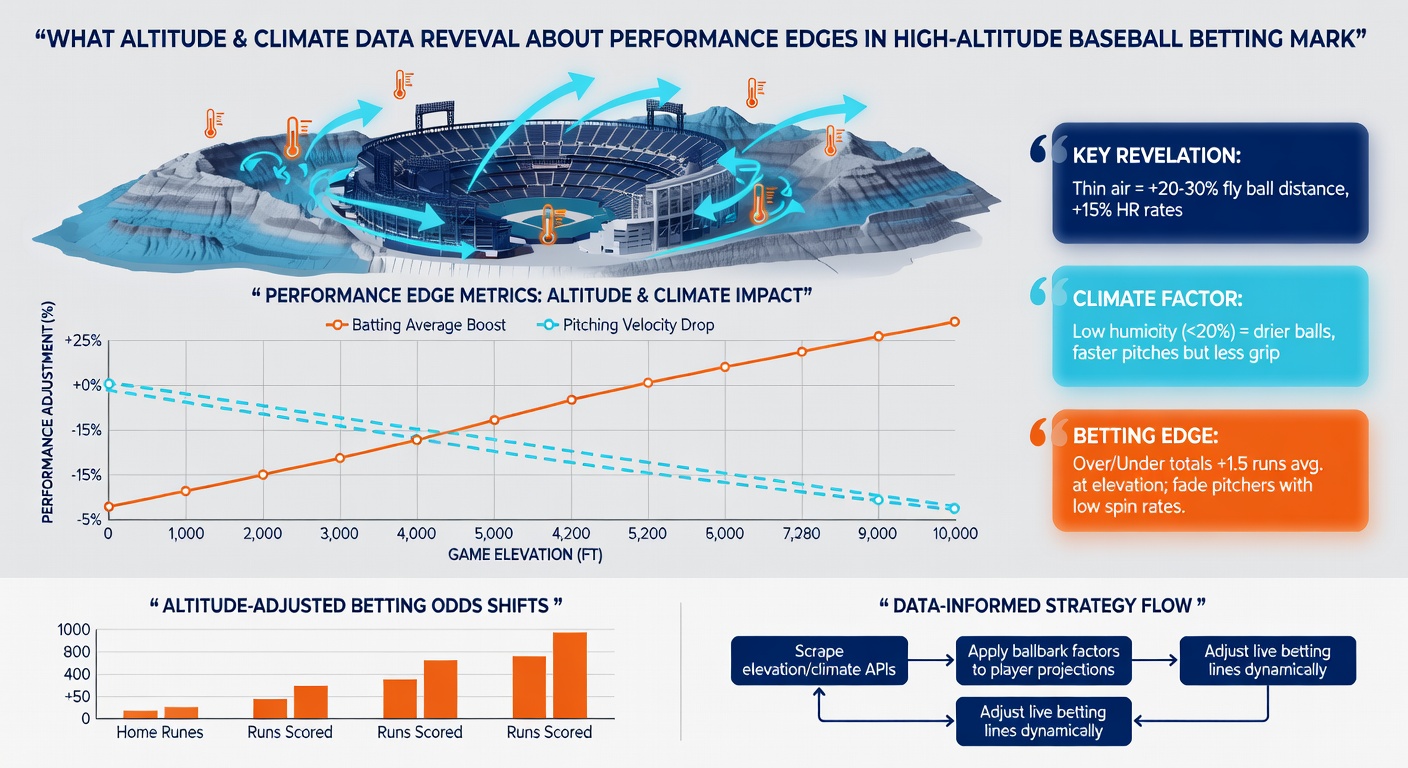
Those who model these interactions often combine elevation data with real-time meteorological readings to refine projections for run totals. One analysis of 2025 games at Coors Field showed that when temperatures exceeded 80 degrees and humidity stayed below 30 percent, the over hit in 68 percent of contests, a figure well above the expected 50 percent baseline. Similar patterns appear at other elevated parks such as Chase Field in Phoenix, although the lower elevation there produces smaller deviations that require tighter weather filters to detect.
Betting Market Responses and Line Movement
Sportsbooks track these environmental factors through proprietary models that integrate altitude, temperature, and wind into their totals and player props. When forecasts indicate strong tailwinds combined with warm, dry conditions, lines on run totals frequently open two or three runs above the seasonal norm for that matchup. Sharp bettors monitor early line movement and compare it against historical splits at specific venues to identify value before the market fully adjusts.
Player props also reflect these edges. Home run props for power hitters at Coors Field carry higher implied probabilities during favorable weather windows, while strikeout props for visiting pitchers often move in the opposite direction because reduced movement increases contact rates. Data from the 2024 and 2025 seasons indicate that strikeout rates for starting pitchers drop by an average of 1.8 per nine innings when they pitch at Coors Field versus their season norms at lower elevations.
Regional Comparisons and Data Sources
Other high-elevation venues provide additional context. Estadio de Béisbol in Mexico City sits above 7,000 feet, and limited exhibition data collected there show even larger home-run spikes, though sample sizes remain small. In contrast, games at Oracle Park in San Francisco, which features marine-layer humidity and lower elevation, produce suppressed home-run totals that create opposite betting tendencies. Comparing these environments helps isolate the specific contribution of altitude versus broader climate effects.
According to records maintained by Environment and Climate Change Canada, temperature and humidity variations at comparable northern latitudes can shift ball carry by measurable margins even at modest elevations, offering a secondary check on models built primarily around U.S. venues. Such cross-regional data sets strengthen projections when series move between parks with different baseline conditions.
Conclusion
Altitude and climate data together create identifiable performance edges that appear consistently in high-elevation baseball markets. Historical records, meteorological measurements, and betting-line archives demonstrate how reduced air density, temperature, humidity, and wind interact to alter run production and pitching outcomes. Market participants who integrate these variables into their analysis gain access to patterns that repeat across seasons, while those who overlook them encounter lines that already embed the environmental reality.