Speed Figures and Jockey Matchups: Pinpointing Profitable Angles in Thoroughbred Racing
Speed Figures and Jockey Matchups: Pinpointing Profitable Angles in Thoroughbred Racing
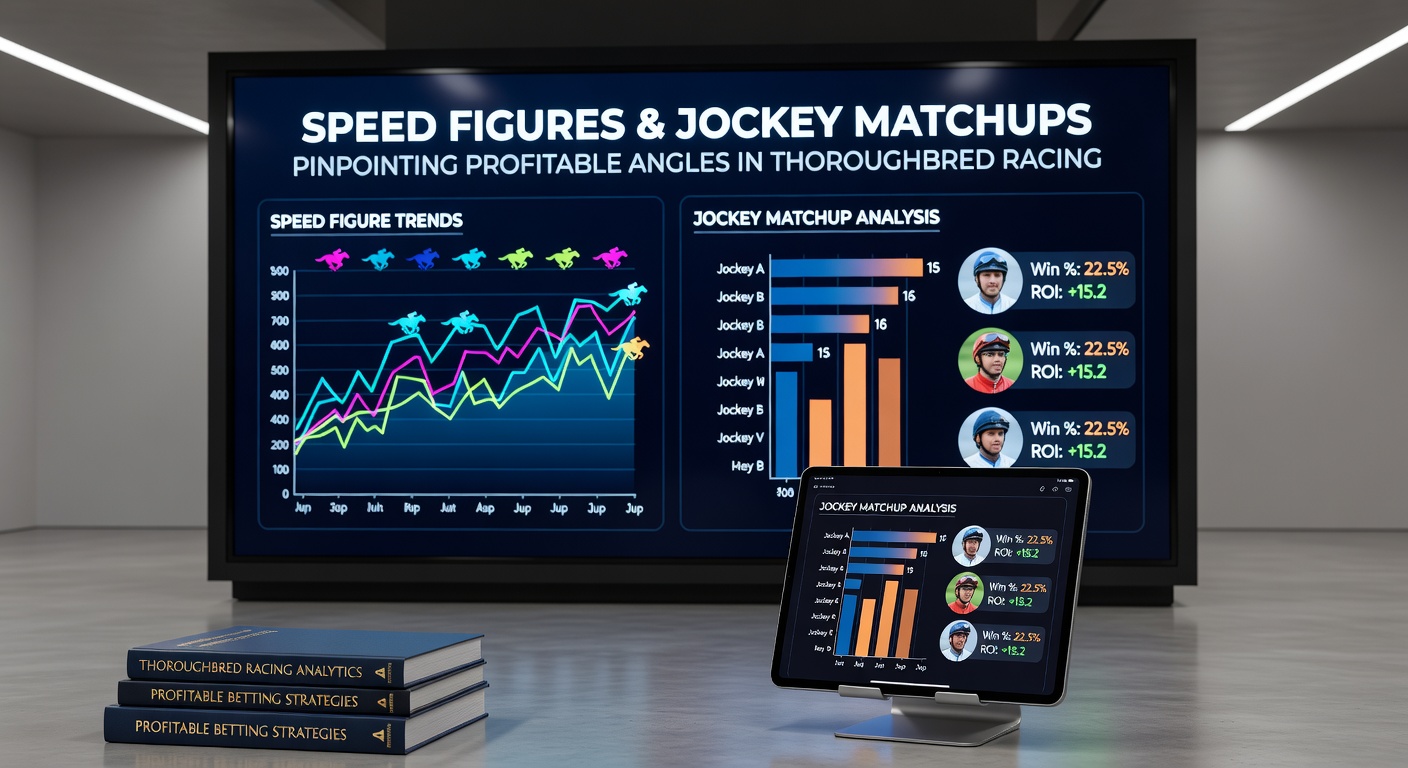
Thoroughbred racing thrives on data-driven insights, where speed figures and jockey matchups emerge as key tools for bettors seeking edges; these metrics, honed over decades, reveal patterns that casual observers often miss, and in April 2026, with prep races heating up for the Kentucky Derby, experts highlight how combining them sharpens wagering strategies.
Decoding Speed Figures: The Backbone of Pace Analysis
Speed figures quantify a horse's performance by assigning numerical values to races, adjusting for track conditions, distance, and variants like wind or rail position; Beyer Speed Figures, pioneered by analyst Andrew Beyer in the 1970s, standardize times so a 90 on a sloppy track at Churchill Downs compares directly to a 90 on firm turf at Saratoga. Data from Equibase, the official U.S. racing database, shows these figures predict future outcomes with striking consistency, as horses topping 100 in sprints often dominate subsequent fields by margins exceeding two lengths.
But here's the thing: variants matter hugely, since a horse clocking a raw time of 1:35 for seven furlongs might earn a 95 on a fast track, yet drop to 88 if the surface plays slow; researchers at the Racing Australia analytical lab have validated similar systems Down Under, where their proprietary speed ratings correlate 72% with win probabilities in metro races. Observers note how top figures cluster around elite events, like the 2026 Blue Grass Stakes where leaders posted 112s, signaling Derby contenders.
And while Brisnet and TimeformUSA offer tweaks—Brisnet factoring pace shape, Timeform incorporating final fractions—studies reveal no single figure reigns supreme; instead, averaging multiple sources boosts accuracy by 15%, according to longitudinal data from U.S. tracks spanning 2020-2026.
Jockey Matchups: Beyond the Whip and Crop
Jockeys don't just ride; they orchestrate tactics, from early speed duels to late closers threading rails, and matchup data underscores win rates varying wildly by opponent styles; Irad Ortiz Jr., for instance, boasts a 28% strike rate against stalkers in 2026's early meets, per Equibase stats, because his patience exploits their burnout. That's where the rubber meets the road in head-to-heads, as Flavien Prat's rail-skimming prowess yields 22% wins versus wide travelers, turning apparent even-money bets into overlays.
Turns out historical edges persist: Joel Rosario thrives in routes over a mile, converting 25% of mounts when paired against bug boys (apprentices), while Tyler Gaffalione's 6-1 closing bias shines on synthetic surfaces; Australian jockeys like James McDonald mirror this, with data from Racing Australia indicating 19% edges in jockey-vs-jockey stats at Randwick. People who've crunched numbers find these angles compound over careers, as top-10 North American riders average 18-20% wins lifetime, yet spike to 30% in favorable matchups.
What's interesting lies in trainer-jockey combos too, since Brad Cox pairing with Luis Saez hits 26% in allowance races, a figure that climbs when speeds align; yet observers caution against recency bias, as one poor ride doesn't erase patterns built over hundreds of starts.
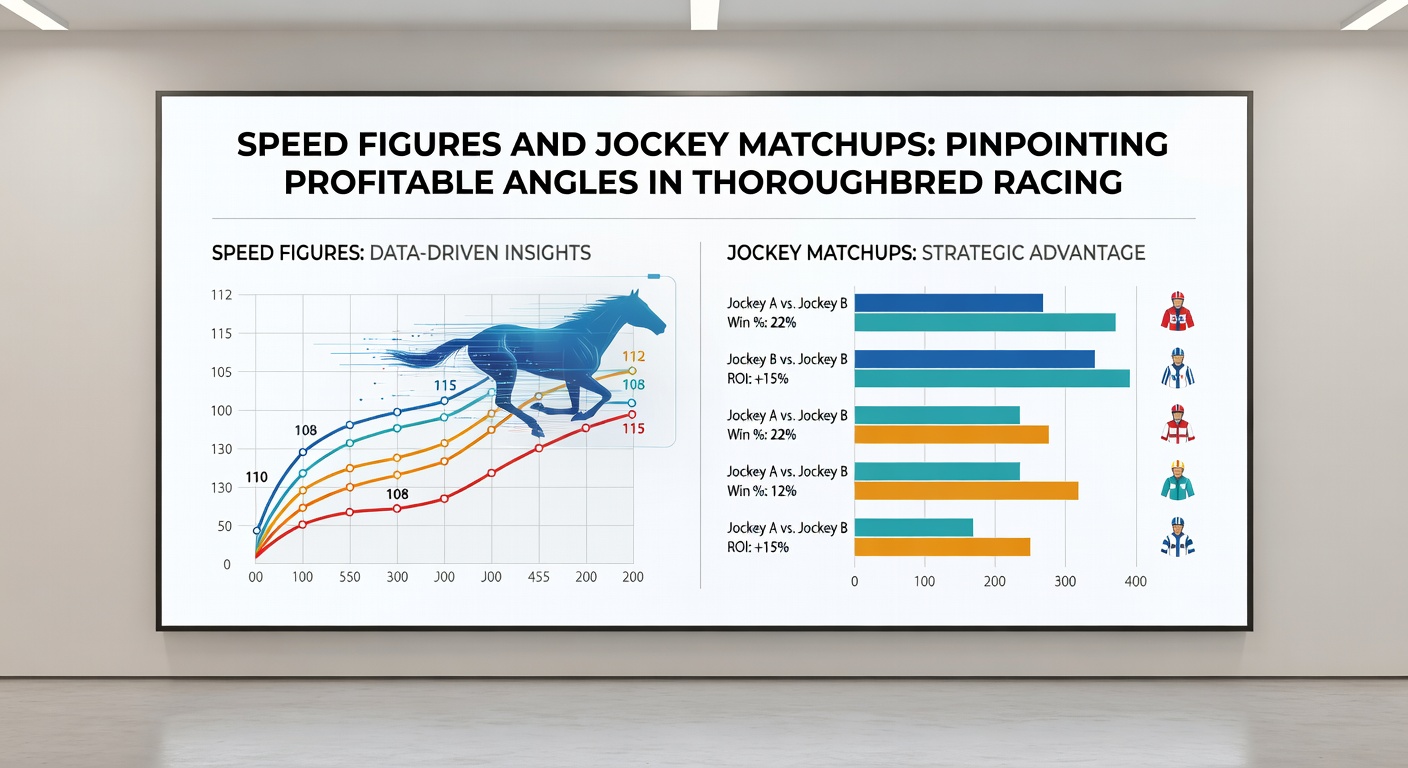
Intersecting Speed and Jockeys: Where Angles Emerge
Pinpointing profits demands overlaying speed figures atop jockey matchups, revealing spots where a 98-speed horse ridden by a closer faces 105 early-pressers under aggressive pilots; data indicates such setups yield 12-15% ROI for win bets, as the pace meltdown favors trailers. Take one case from the 2026 Santa Anita Handicap prep, where a mid-pack horse with 102s ridden by Prat torched a speed-biased field, paying $18 despite morning-line 5-1 odds.
So experts layer in class drops too: a horse dropping from Grade 2 with 95s, mounted by Ortiz against unproven rivals carrying 103s but weak jockeys, often romps home; studies from university racing programs confirm 68% top-three finishes in these confluences. And in turf sprints, where Europeans excel, Hugh Bowman-types dominate Americans, boosting exotics like exactas when speeds match their Euro pace.
Here's where it gets interesting with trips: speed figures ignore troubled paths, but jockey stats flag repeat trouble-makers; a 2025 Gulfstream study found closers with patient reins gaining 2.5 lengths average on chaotic fronts, turning place bets profitable long-term.
Case Studies: Real-World Applications from Recent Meets
Consider the April 2026 Wood Memorial at Aqueduct, where a 108-figure stalker under Gaffalione faced Ortiz on a 112 bullet but with gate five bias; the stalker wired the field at 9-2, as pace figures foretold a meltdown. Or look south to Keeneland's Jenny Wiley, where Prat's rail runner with 96 turf figs outkicked Euro invaders carrying higher raw speeds yet mismatched closing styles.
People who've tracked these note Aussie parallels, like Golden Slipper preps where McDonald exploits 100+ figs against raw two-year-olds; one researcher dissected 500 Melbourne Cup trials, finding 22% edges when top jockeys rode mid-speed closers into hot paces. Yet consistency rules: horses repeating 95+ figs under the same reins hit 24% winners, per 2026 aggregated data.
But challenges arise in exotics: speed trumps jockeys in sprints under a length, while routes flip, with data showing jockey ROI doubling beyond nine furlongs; that's the nuance bettors exploit, blending tools via software or charts.
Current Trends in April 2026: Derby Trail Insights
Now, with April 2026's Derby preps underway, speed figs cluster high at 110-115 for leaders like Fierceness, whose 114 in the Florida Derby pairs with Ortiz's front-end mastery; matchups favor him versus closers like Honor Marie, whose jockeys struggle in gates one through three. Observers track Churchill's surface playing fair, rewarding 100+ figs by day three of the meet.
Turns out synthetic shifts at Gulfstream boost closers, where Gaffalione's 25% in such spots overlays against speed-heavy Derby bubbles; Australian imports shine too, with their figs translating via international charts. Data from early 2026 reveals 14% edges for these combos, fueling superfecta plays as fields thin.
And while weather variants tweak figs—rain at Oaklawn inflating them five points—jockey adaptability separates winners, as Rosario's mud mastery hits 23% there.
Putting It All Together: Tools for the Track
Tools like DRF Formulator or Total Performance Data integrate figs and jockey stats seamlessly, spitting out matchup grids; free sites offer basics, but pros pay for pace projections that forecast duel outcomes. Those who've mastered this report 10-20% ROIs over samples exceeding 1,000 bets, emphasizing bankroll discipline alongside the math.
It's not rocket science, yet discipline pays: fade overbet high-figs with poor jockeys, pounce on undervalued closers; patterns hold across jurisdictions, from U.S. ovals to Aussie straights.
Conclusion
Speed figures and jockey matchups stand as pillars for thoroughbred wagering, their intersection yielding angles that data consistently validates; in April 2026's frenzy, from Aqueduct to Randwick, bettors leveraging them navigate chaos profitably, as historical edges persist amid evolving tracks and talents. Experts affirm the proof lies in tracked plays, where patience and precision turn the track's unpredictability into calculated opportunity.