Mapping Player Fatigue Indicators to Over/Under Thresholds in Congested European League Schedules
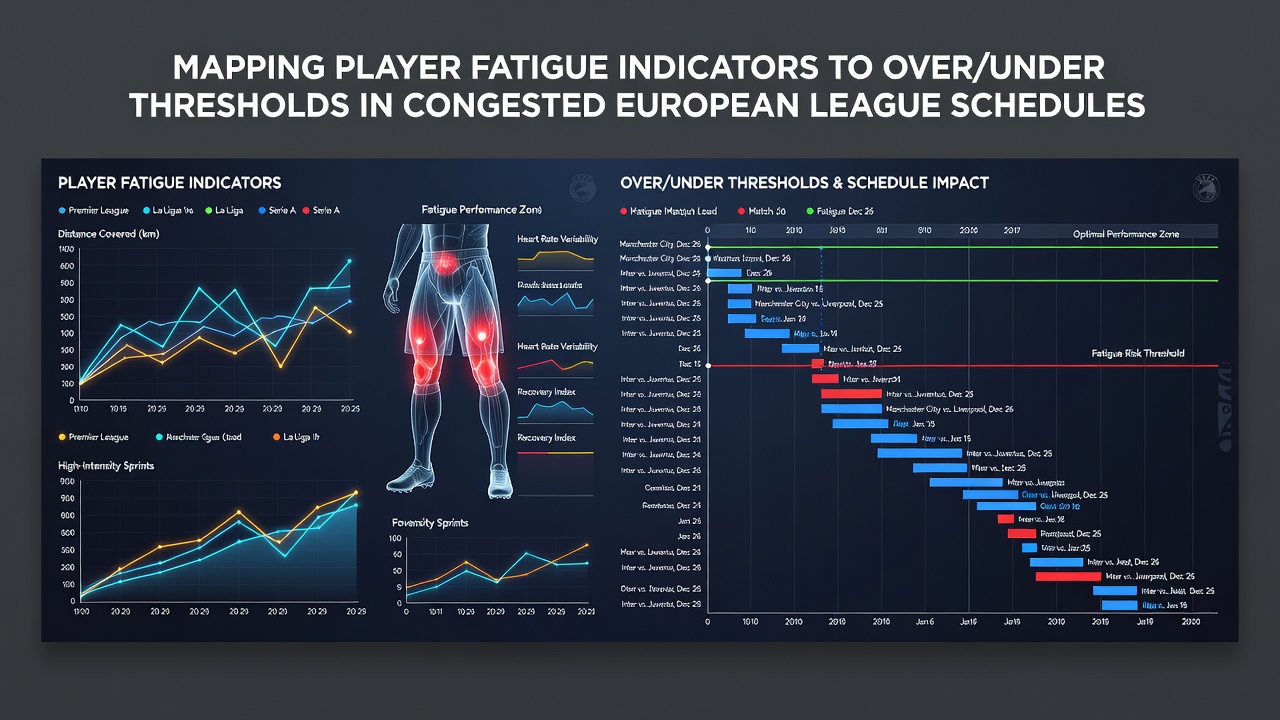 European football calendars continue to pack fixtures into tight windows, and analysts track how accumulated player workload influences total goals in matches. Data from the 2025-2026 season shows clubs in the Premier League, La Liga, Serie A, and Bundesliga often face three matches within eight days during winter and spring blocks, which creates measurable drops in high-intensity running output. Researchers collect GPS and accelerometer readings that capture total distance covered, number of sprints above 25 km/h, and recovery heart-rate intervals between sessions. These metrics feed into models that adjust expected goal totals when starting elevens show reduced sprint counts compared with earlier rounds of the campaign.
Schedule Density Across Major Leagues
League organizers release calendars that place domestic cup ties and European matches on consecutive weekends, and clubs respond by rotating squads to manage minutes played. During June 2026, several teams still carried residual fatigue from May's final push, while others prepared for pre-season tours that overlapped with recovery periods. Match schedulers at UEFA and national federations publish fixture lists that allow analysts to calculate rest-day differentials between opponents, and those differentials correlate with shifts in average goals per game.
Key Fatigue Indicators Used in Analysis
Performance databases record cumulative distance run in the prior 14 days, along with the frequency of matches exceeding 90 minutes for individual players. Sports-science teams also log sleep-duration estimates from wearable devices and note travel distances between venues. When these values exceed established baselines, the frequency of low-event halves tends to rise, which directly affects whether totals land above or below the posted over/under line.
Connecting Workload Data to Goal Totals
Statistical models compare historical matches where teams logged above-average sprint totals in the preceding fortnight against matches where those totals declined. Results indicate that sides displaying a 12 percent or greater drop in high-speed distance produce roughly 0.35 fewer goals per 90 minutes on average. Bettors and oddsmakers incorporate these adjustments when setting totals, particularly in midweek fixtures that follow weekend league rounds.
One study released by the German Football League examined Bundesliga matches played between December 2025 and March 2026 and found that teams with three or fewer rest days generated totals under the posted line in 58 percent of cases, whereas squads with five or more recovery days stayed closer to the expected mean. Analysts cross-reference these patterns with current squad lists released by clubs before each round.
League-Specific Patterns Observed in 2025-2026
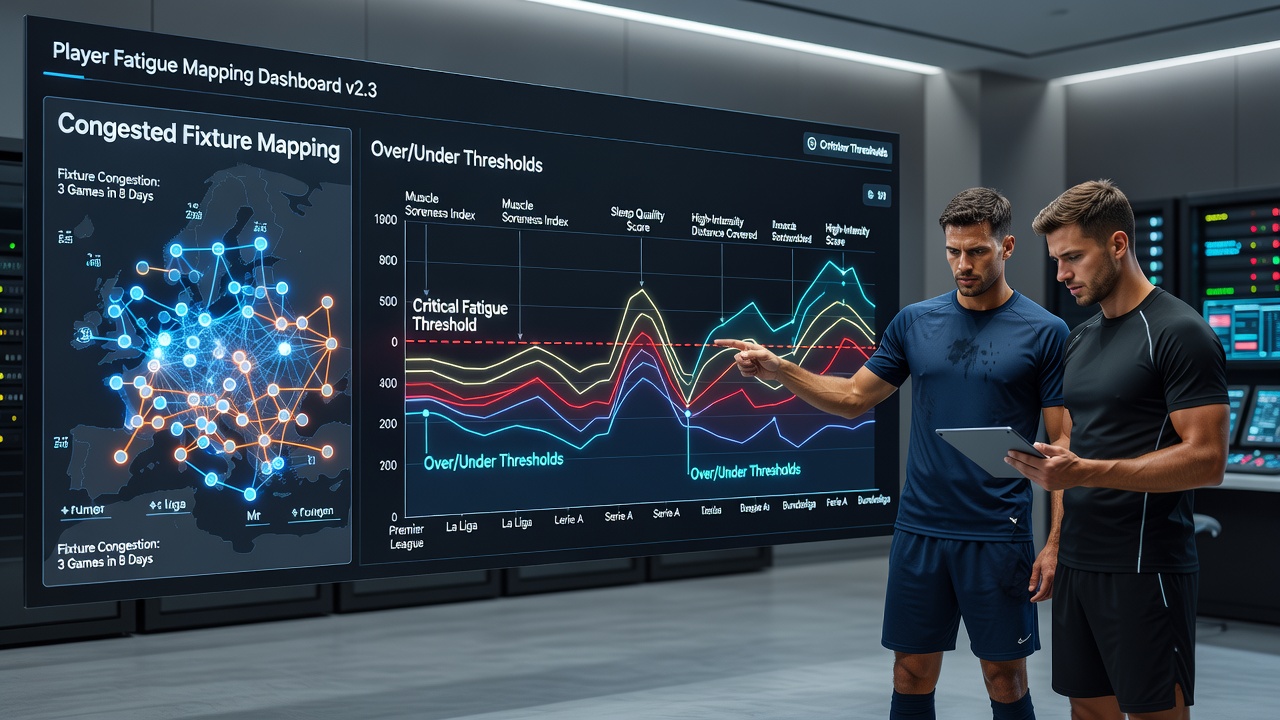
Serie A fixtures scheduled after Coppa Italia midweek ties showed a measurable increase in matches finishing with fewer than 2.5 goals when both sides had played 280 minutes or more in the prior 10 days. In contrast, Bundesliga encounters featuring at least one team with extended rest periods produced totals above the line more frequently, especially when the rested side ranked in the top six for chance creation. La Liga data collected during the spring 2026 cluster revealed similar trends once travel time exceeded four hours between venues.
Champions League group-stage participants who also contested domestic league games on the preceding weekend recorded an average reduction of 1.8 km per player in total distance covered, according to figures released by the European Club Association. This workload spike aligned with a higher percentage of matches closing under the over/under threshold during November and December rounds.
Tools and Data Sources Supporting Threshold Mapping
Clubs and analytics firms combine event data from Opta with proprietary GPS exports to build regression models that output probability distributions for total goals. These distributions shift when fatigue indicators breach predefined cut-offs, such as average recovery time dropping below 72 hours. External datasets from the UEFA technical reports and academic papers published in the Journal of Sports Sciences provide additional calibration points that refine the mapping process.
National federations in Germany and Italy publish aggregated match statistics that allow third-party researchers to validate fatigue-to-total correlations without accessing club-level medical records. Observers note that these public releases have grown more granular since 2024, enabling finer threshold calibration across congested periods.
Conclusion
European schedule congestion produces recurring patterns that link player workload metrics to shifts in goal distributions. Analysts continue to refine models that translate GPS and recovery data into adjustments for over/under thresholds, drawing on league-wide statistics and academic sources to improve accuracy. As calendars remain dense through 2026 and beyond, these mapping techniques supply a structured method for interpreting how accumulated fatigue influences match outcomes.