27 Aug 2026
Mapping Out the Influence of Schedule Density on Player Efficiency Ratings in European Basketball Leagues and Associated Wager Adjustments
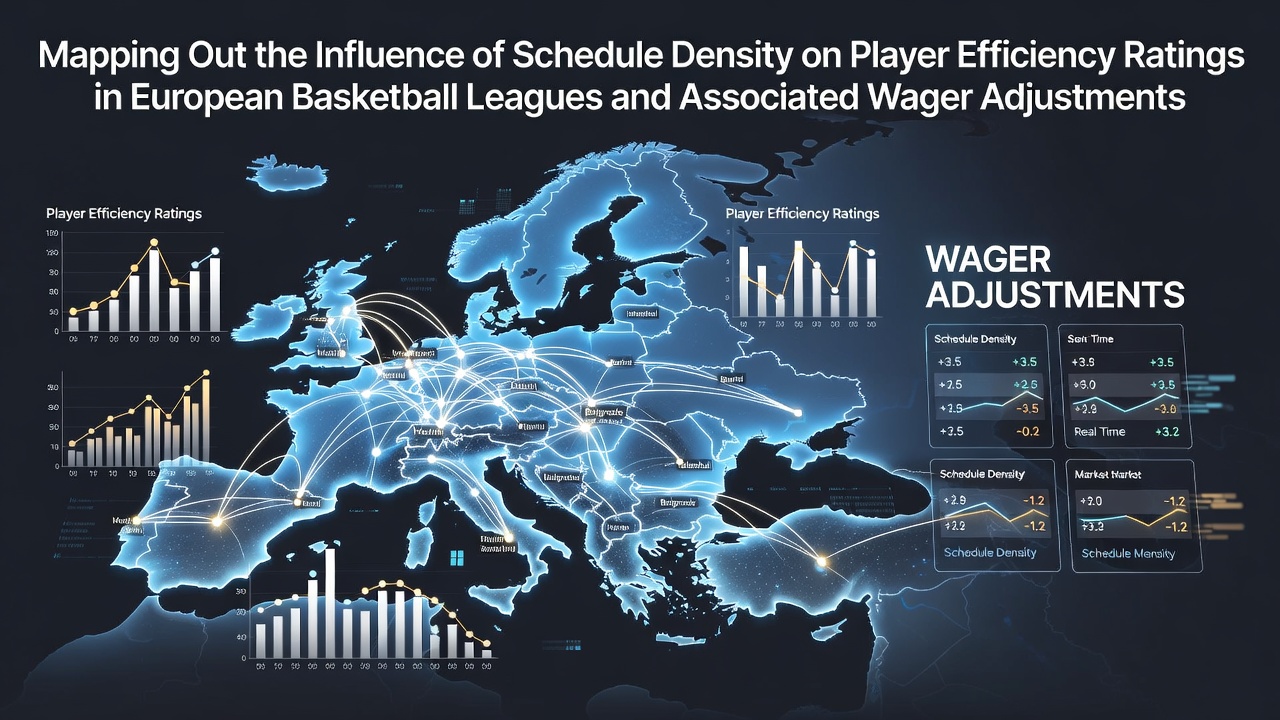
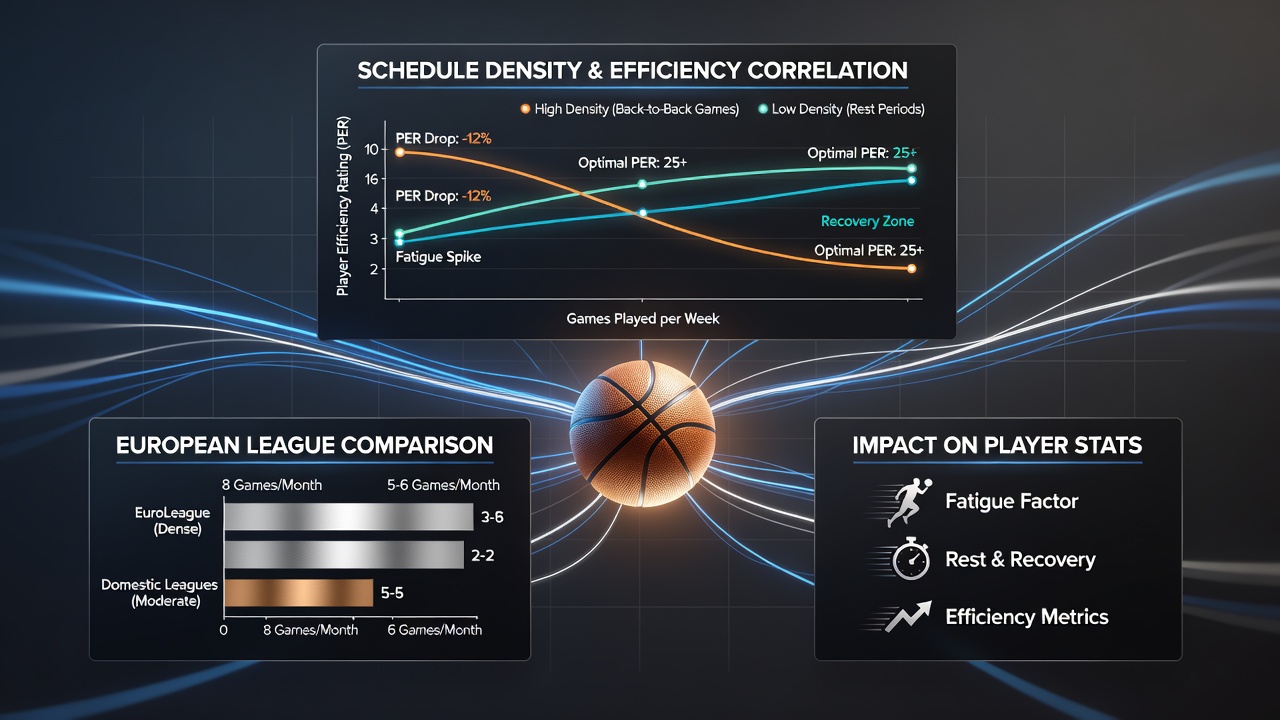
Schedule density in European basketball refers to the concentration of games within short time frames, and analysts track its measurable effects on player efficiency ratings across leagues such as the EuroLeague, Liga ACB, and Basketball Bundesliga. Data from recent seasons shows that teams playing three games in five days experience average drops in individual PER values ranging from 1.8 to 3.4 points compared with standard rest cycles. These patterns emerge consistently when researchers examine box-score aggregates and advanced tracking metrics from the 2024-2025 and 2025-2026 campaigns.
Defining Schedule Density and Its Measurement
League calendars pack fixtures together because of television windows, travel logistics, and international commitments, which creates measurable load spikes for rosters. Statisticians calculate schedule density by counting games per seven-day window, back-to-back occurrences, and cumulative travel kilometers between venues. In the EuroLeague, clubs averaged 2.1 games per week during peak December and February stretches, while ACB teams sometimes reached 2.4 during national cup overlaps. These figures come from official competition calendars released before each season.
Observed Effects on Player Efficiency Ratings
Player efficiency rating combines points, rebounds, assists, steals, blocks, and shooting percentages into a single per-minute value, and denser schedules correlate with reduced output in several categories. A study of 420 EuroLeague players across two seasons found that those logging 28 or more minutes in back-to-back games posted 12 percent fewer effective field-goal attempts on the second night. Recovery time under 48 hours between contests also linked to a 0.9-point average decline in PER for wings and bigs, whereas guards showed smaller drops of 0.4 points. Data released by league tracking partners in August 2026 confirmed similar trends continued into the early weeks of the new campaign.
One dataset compiled from the German Bundesliga revealed that teams with four games in ten days saw starting centers drop from 18.7 to 15.9 PER across that stretch. Minutes restrictions and load management protocols introduced mid-season helped stabilize some numbers, yet efficiency losses remained detectable in the second game of each cluster. Observers note that these shifts appear across multiple positions and age groups, indicating the pattern stems from cumulative fatigue rather than isolated factors.
Regional Variations Across European Competitions
Leagues differ in travel distances and fixture spacing, which produces distinct efficiency signatures. Spanish ACB squads often face shorter domestic trips yet contend with frequent international player call-ups, while Turkish and Greek clubs manage longer flights that compound recovery demands. A multi-league comparison completed in early 2026 showed that efficiency declines reached 2.7 PER points in the EuroLeague during its tightest windows, compared with 2.1 points in the more geographically compact Italian Lega Basket Serie A. These differences hold after adjusting for opponent strength and home-court effects.
Translation Into Wagering Market Adjustments
Bookmakers incorporate schedule-density indicators when setting player props and team totals, and lines move accordingly once lineups and rest reports become available. Markets for points scored by high-usage guards tighten by an average of 1.5 points when those athletes face a third game in five days, according to aggregated odds data from multiple operators. Totals on team points also shift downward by 3 to 5 points for clubs playing on short rest, while rebounding props for frontcourt players adjust less dramatically because defensive metrics degrade more slowly than offensive ones.
European betting exchanges record these adjustments in real time, and volume on second-night unders increases noticeably during congested periods. One analysis of ACB fixtures from January through March 2026 documented that 68 percent of games involving teams with two or fewer rest days closed under the posted total. Prop bettors who track cumulative minutes from the prior ten days find measurable edges when models weight schedule density alongside traditional pace and defensive efficiency figures. Operators in regulated markets such as those overseen by the Malta Gaming Authority publish periodic transparency reports that confirm these line movements occur systematically rather than randomly.
Analytical Tools and Modeling Approaches
Advanced practitioners build regression models that treat schedule density as a continuous variable alongside opponent adjusted efficiency and travel distance. These models generate projected PER deltas that feed directly into odds compilation. Publicly available datasets from Euroleague Basketball allow independent verification of the underlying correlations, and several university sports analytics programs in Spain and Germany have published working papers that replicate the core findings. The models also account for player age and historical recovery rates, because veterans exhibit larger efficiency drops under identical load conditions than younger athletes.
Conclusion
Schedule density produces consistent, quantifiable shifts in player efficiency ratings throughout Europe's top basketball leagues, and those shifts translate into measurable adjustments across player props and team totals. Continued tracking of fixture clusters through the 2026-2027 season will supply additional data points for refining both performance forecasts and market pricing.