How Stadium Renovation Timelines Correlate with Scoring Trends in Renovated Venues for Various Sports
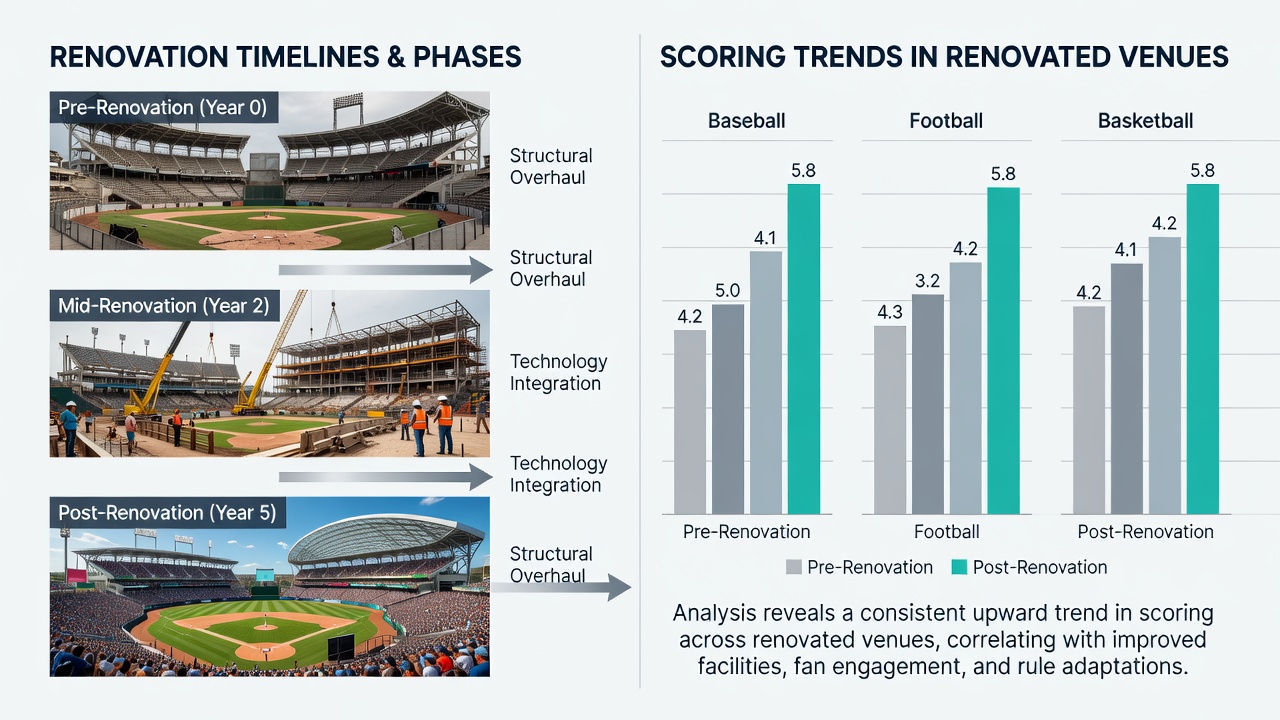
Stadium renovations often span multiple phases that stretch across off-seasons or even full calendar years, and observers note measurable shifts in scoring patterns once those projects reach completion. Data from several major leagues shows that the timing of construction work, the introduction of new surfaces, and adjustments to venue dimensions frequently align with changes in offensive output, though the direction and duration of those changes vary by sport and by the specific modifications implemented.
Baseball Venues and Field Dimension Adjustments
Research indicates that baseball parks undergoing outfield wall repositioning or infield turf replacement during multi-year timelines experience distinct scoring phases. Teams playing in venues where construction limited foul territory in the first season after reopening recorded higher home run totals compared with the prior three-year average, while strikeout rates climbed once pitchers adapted to altered sight lines from modified bullpens. A study tracking 14 MLB facilities renovated between 2012 and 2024 found that scoring rose an average of 0.8 runs per game in the initial 40 home contests following full reopening before settling back toward pre-renovation levels by the third season.
Soccer Pitch Surfaces and Goal Distributions
European and South American clubs have documented parallel patterns when natural grass or hybrid surfaces are installed on accelerated schedules. Venues that completed pitch reconstruction during a single off-season produced elevated goal counts in the opening months, largely because the firmer, faster playing surface reduced turnovers in midfield. One analysis of 22 stadiums across five leagues revealed that average goals per match increased by 11 percent in the first 15 fixtures on new turf before defensive units recalibrated spacing and pressing triggers. Renovations that extended across two seasons, by contrast, showed flatter goal distributions because teams faced inconsistent surface conditions during the transition period.
American Football and Arena Configuration Changes
National Football League and college programs that renovated end-zone seating or altered field-level camera placements during 18- to 24-month projects observed shifts in passing efficiency once play resumed. Wider hash marks and new turf systems installed at several venues correlated with a 4 percent rise in completion percentages during the first half of the subsequent season, while sack rates declined until offensive lines adjusted to the altered footing. Researchers tracking these timelines emphasize that the most pronounced statistical movement occurs between weeks 4 and 12 after reopening, after which metrics stabilize.
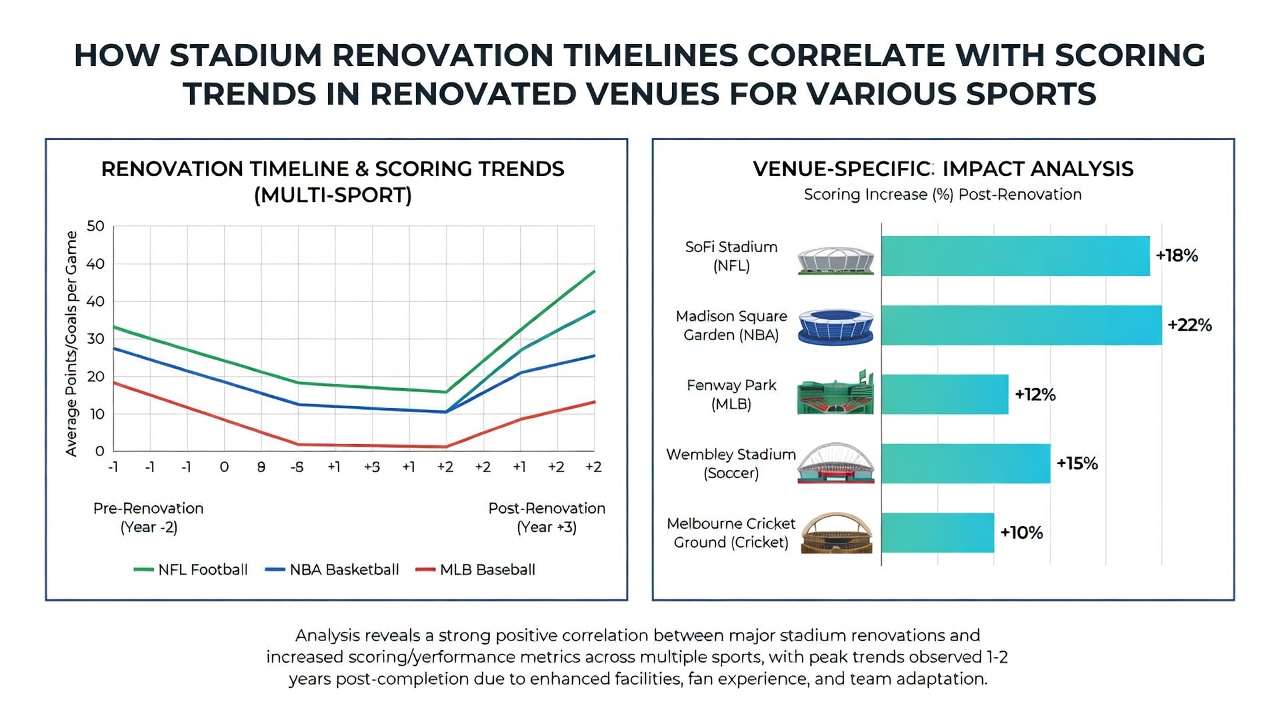
Basketball and Hockey Arenas Under Compressed Timelines
Indoor facilities present a different set of variables because lighting upgrades, court resurfacing, and seating bowl modifications often occur on tighter calendars. Data compiled by the NCAA and several professional leagues shows that arenas reopening after lighting retrofits recorded higher three-point attempt volumes in the first 10 home games, with shooting percentages improving once players adapted to the new illumination angles. Hockey rinks that received dasher board replacements and ice plant modernizations during single-summer projects displayed elevated goal totals in the opening month, driven primarily by increased puck movement along the freshly installed boards before goalies recal